How surface electrocardiography works
How surface electrocardiography works
It’s worth having at least a rough sense of how surface electrocardiography actually works, if only to appreciate why a few stickers on the skin can reveal so much about the heart.
In plain terms, each heartbeat generates tiny electrical signals that spread outward through the chest until they reach the surface of the body. Electrodes placed at different points on the skin pick up small voltage differences as these signals pass by, and the ECG machine plots those changing voltages as the waveforms we see. Inside the heart, of course, countless signals are moving in different directions at the same time, but what the ECG records is the overall, or “net,” effect of all that activity summed together. The machine then tracks this net electrical activity from moment to moment and lays it out over a set period of time (usually ten seconds for a standard ECG), giving us the continuous tracing we use for interpretation.
Of course, that is the polite, surface-level version. This lesson offers an optional yet more extensive look into the science that makes electrocardiography possible. Full disclosure: you probably don’t need to know the physics behind ECGs in this amount of detail to read ECGs competently. This part is for the curious, for anyone who wants to peek under the hood and see how electrodes on the skin can detect electrical signals from all the way inside the heart. Here goes!
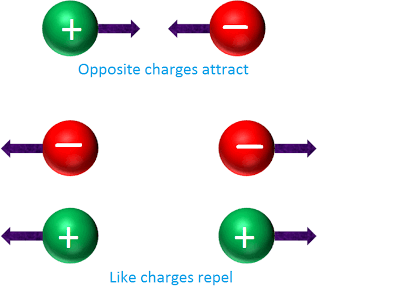
The physics of electricity starts with electric charge, a property of matter that’s either positive or negative and has a magnitude measured in Coulombs. The interaction of charges is governed by a simple rule: like charges repel, and opposites attract. This force is incredibly strong up close but weakens dramatically with distance, in accordance with the inverse-square law (if you double the distance between two charges, the force between them drops to a quarter of the original). The force is also proportional to the magnitudes of the charges interacting, and is mathematically summarized by Coulomb’s law.
But how do charges exert forces on one another across empty space? That’s where the concept of an electric field comes in.
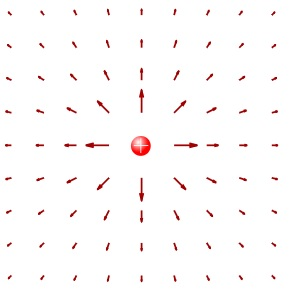
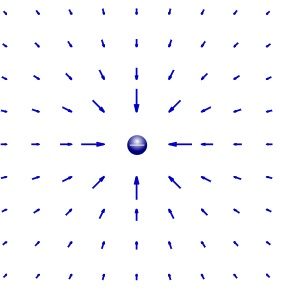
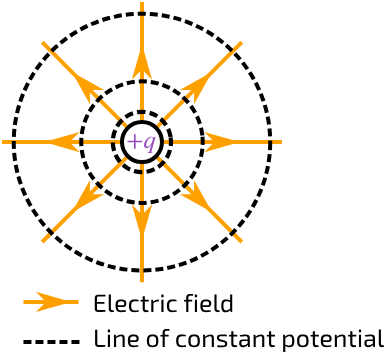
To visualize this, imagine a lone positive source charge fixed in space. If you were to place a small “test” charge anywhere nearby, it would be pushed directly away with a force dependent on its proximity. The electric field is the complete map of these potential forces at every point in space, represented by vectors that show the direction and magnitude of the force.
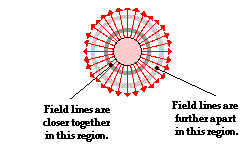
Another visual tool for representing electric fields are field lines, which show the direction a positive test charge would move if placed in the field, with arrows to indicate direction, and density of lines in some area correlating to the relative strength of the field at that location.
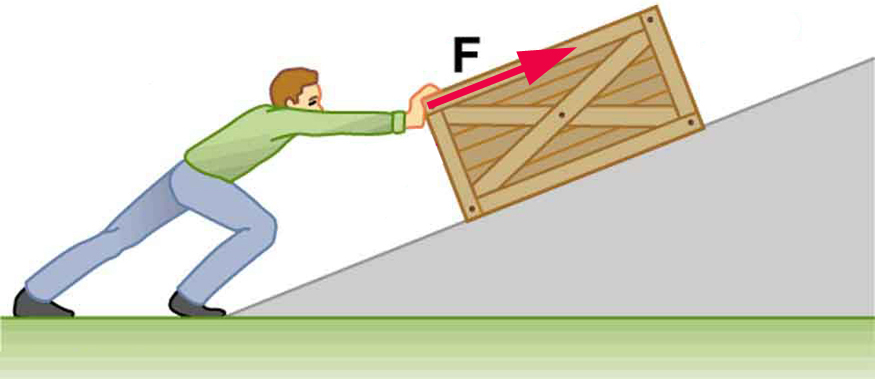
In physics, work refers to the energy transferred to an object when a force is applied, causing it to move. For example, applying a force to push a box up a hill means we’re doing work on (i.e., transferring our energy to) the box. Work and energy are measured in Joules. Notice energy is “transferred” to the box. That energy is then stored in the box as potential energy, which represents the potential to do work later. If we let go of the box, its potential energy gets released, causing it to slide back down the hill.
The same idea applies to electric fields. To move a positive “test” charge closer to a positive “source” charge, you must apply force and do work against the natural repulsion between the charges. The work you do is stored in the test charge as electrical potential energy. If you were to let go, this stored energy would be released, sending the test charge accelerating away from the source.
The amount of electric potential energy a charge has depends on two things: the location in the electric field and the magnitude of the charge. At the same location, a larger charge holds more energy than a smaller one. This parallels gravity: a heavy boulder and a light pebble at the same height have different amounts of gravitational potential energy because of their different masses.
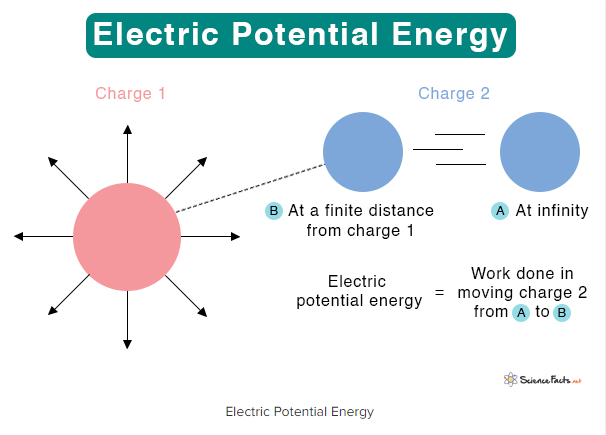
Electric potential, or voltage (which is measured in Volts), is a way to represent the “potential energy level” at a location in an electric field, independent of charge. It’s like “height on a hill”: a property of the location itself regardless of the size of the object at that spot. Formally, it’s equivalent to the potential energy per unit charge — i.e., the energy a 1-coulomb charge would have at that spot.
But electric potential can’t be defined at a single point in isolation. It must be measured relative to a reference point. Absolute zero potential would exist only infinitely far from a source charge, since Coulomb’s law tells us the force never fully vanishes at finite distance. Because “infinity” isn’t practical, we instead measure potential differences between two finite points. Voltage, then, is best understood as a potential difference: it tells us exactly how much energy a 1-coulomb charge gains or loses when moving between two points in the field.
In an electric field, certain locations share the same electric potential, just as many points on a hill can have the same elevation. If we connect all those points, we form an equipotential line. This is directly analogous to a topographic map, where each contour line marks points of equal height.
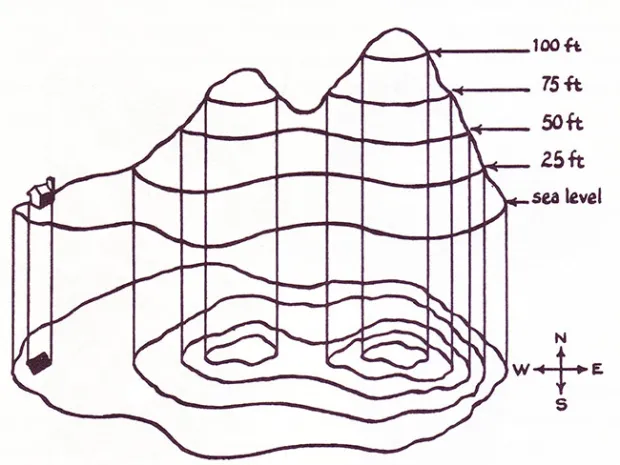
A crucial insight is that moving a charge along an equipotential requires no work. Since the potential is the same everywhere on the line, there’s no energy difference to overcome. It’s like walking along a contour line on a hill: you may change your position, but you’re not going uphill or downhill, so you don’t expend effort against gravity. Equipotential lines are the “paths of least resistance” for charges in an electric field.
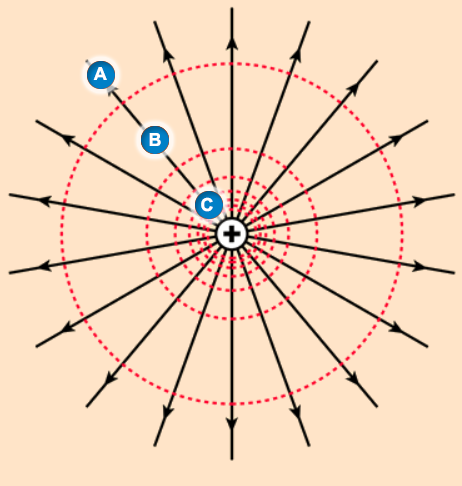
Another key idea is that the farther you are from the source of an electric field, the weaker the force becomes, and with a weaker force less energy is required to move a charge. For example, in the field depicted to the left, moving a charge from A to B requires less work than moving the same charge from B to C, even though the distances traversed by the charge are identical.
The reason lies in the inverse square law: the strength of the electric force does not fall away gradually but instead drops off very sharply with distance. Near the source the field is strong, so even a small step outward demands considerable work. Further away the field is faint, so an equal step outward requires much less. This means the potential difference between A and B is smaller than the potential difference between B and C, despite the fact that the distances between them are exactly the same.
Dipoles are everywhere in nature and are an essential concept for understanding how electrocardiography works, but they can be tricky to grasp at first. Let’s use an analogy.
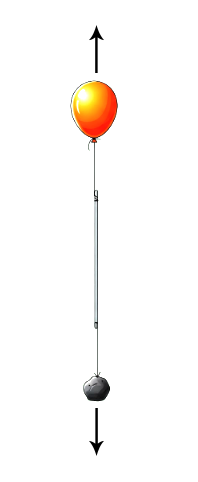
Imagine a curious object: the “floating lever”, a lightweight rod with a helium balloon tied to one end, pulling upward strongly, and a small rock at the other, weighing just enough to cancel the balloon’s buoyant force. This rod is perfectly balanced; the upward force on the balloon is exactly balanced by the downward force of the rock, so the lever experiences no net vertical force. If you let go of it in the air, it neither rises nor sinks. It simply hovers.
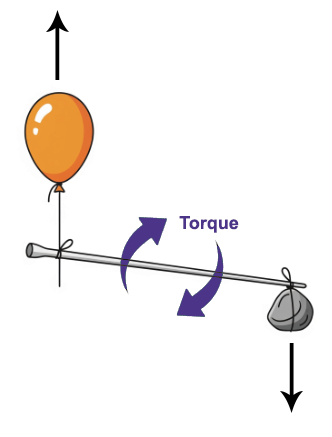
Now, consider it in Earth’s gravitational field. Despite the opposing forces being balanced, because they act at different ends, the lever experiences a rotational force, or torque. Hold it horizontally and let go: it immediately rotates, eventually aligning vertically with the gravitational field — balloon up, rock down; its most stable orientation.
This floating lever is a good analogy for an electric dipole. An electric dipole is created when you have two equal but opposite charges (one positive, one negative) separated by a fixed distance.
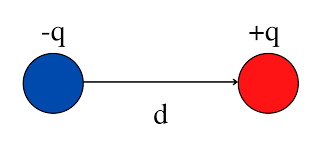
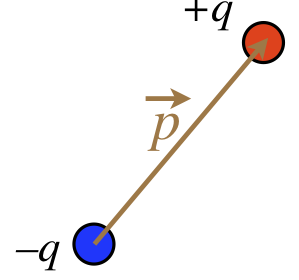
Dipoles have an important property called the dipole moment. For every dipole, its “moment” is a vector that points from the negative charge to the positive charge. Its magnitude represents the dipole’s strength, increasing with both the size of the charges and the distance separating them.
Like the floating lever, an electric dipole placed inside a uniform electric field will stay in place, since the pull on the negative charge balances the push on the positive. But it does feel torque, causing it to rotate in place in order to align with the field. Intuitively, a larger dipole moment means:
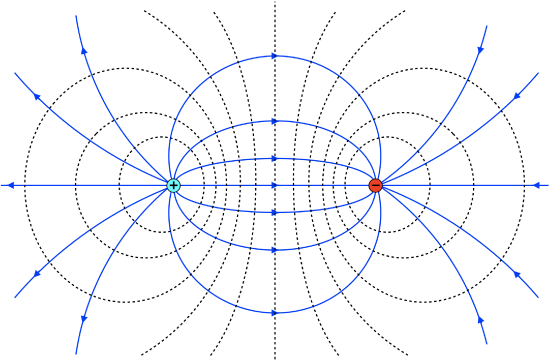
Dipoles also generate their own electric fields. This is the more important tidbit for understanding ECGs. The stronger the dipole moment, the greater the electrical asymmetry, and the stronger the field the dipole produces.
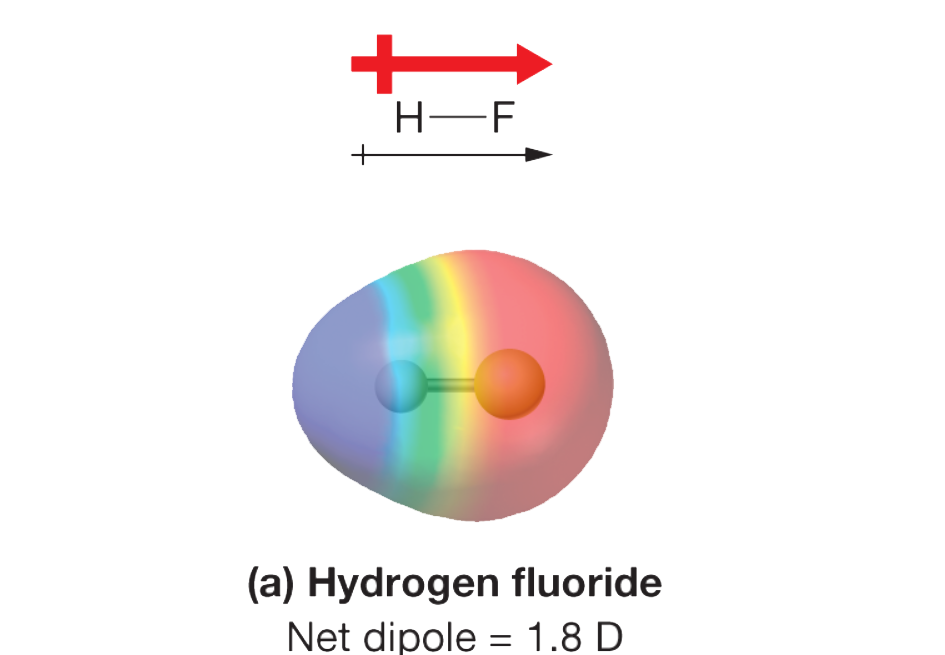
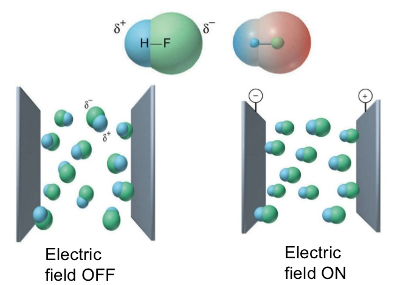
A practical example: think of polar molecules from chemistry class. Each molecule has a dipole, and these dipoles interact with other charges and with each other. These interactions are the basis for many intermolecular forces that hold liquids and solids together, illustrating how dipoles influence matter on a fundamental level.
Now that we’ve learned (hopefully) what a dipole is, we have all the tools in our toolbelt to understand the physics behind how surface electrocardiography works, and how stickers on the skin can detect electrical activity inside the heart.
In the very first lesson of this site, we said “The heart muscle contracts because of a precise sequence of electrical impulses that travel through it in a predictable pattern.” But where do these impulses come from, and how do they travel? Although we can (and eventually will) get into the intricate electrophysiologic details of how this happens, let’s start with a bigger picture overview.
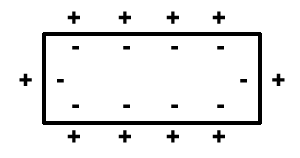
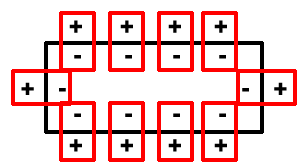
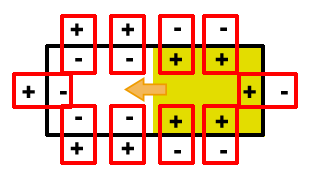
The inside of a cardiac cell is negative charged and the outside is positively charged, due to the function of several ion pumps and channels. The cell membrane, shown here on the left as a crude rectangle, can be thought of as a series of small dipoles. Each dipole is outlined in red in the diagrams below, with its dipole moment shown as a blue arrow. In this stable, resting state, the dipole moments more or less cancel each other out; there are arrows pointing in all directions, so no overall “net direction” emerges.
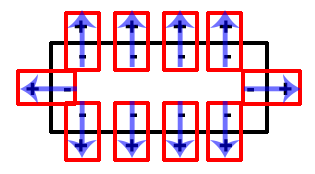
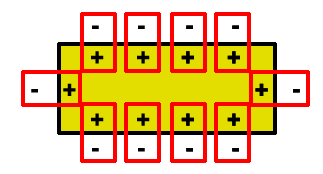
Although we’ll spare the mechanistic details this time, cardiac impulses are incited and traverse the heart via a process called depolarization. Depolarization is essentially the “switching” of resting polarities across the cell membrane due to transmembrane movement of ions — the inside becomes relatively more positive in relation to the outside. This depolarization starts at one part of the cell and spreads like a contagion across the entire cell membrane until the cell becomes fully depolarized. In the diagrams below, you can see this process in action: a depolarization wave (in yellow) spreads from the right side of the cell towards the left until the entire cell is depolarized.
As ions shift and the membrane’s polarity changes, the dipoles and dipole moments also change. This creates a net dipole moment for the cell, which has a specific direction and magnitude.
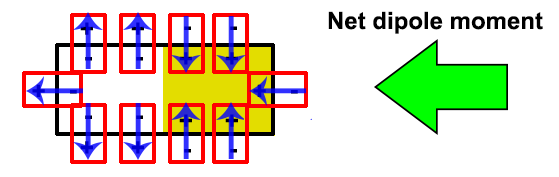
The net dipole moment points in the direction of the moving depolarization wave and is a marker of electrical conduction. Cells that are already depolarized have “balanced” dipole moments, similar to resting cells, and therefore don’t create a net dipole moment. This means that a net dipole moment is only present in cells that are actively depolarizing.
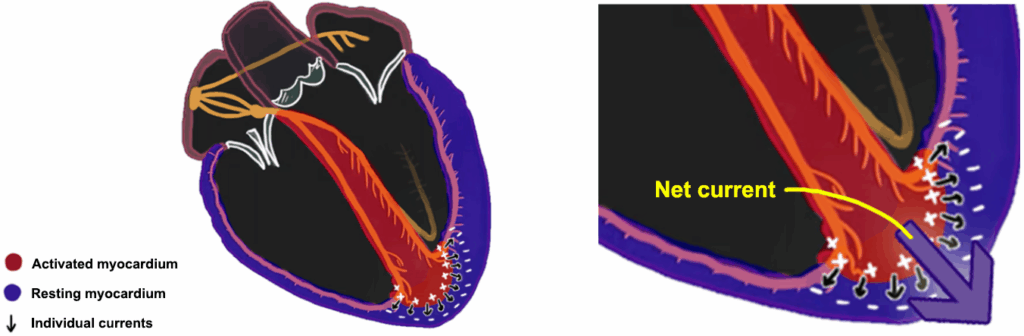
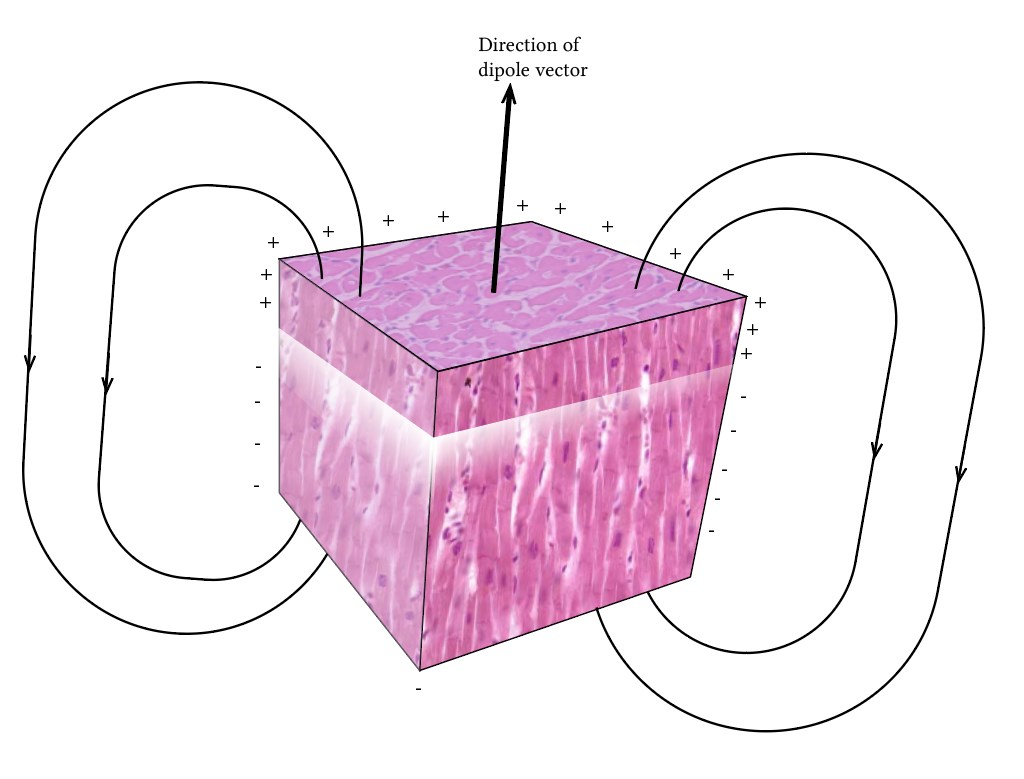
When we zoom in on a group of myocardial cells, as shown in the diagram below of the tissue cube, the cells in the depolarization wavefront (those actively depolarizing) generate a net dipole moment in the direction of the wave. Since you know that dipole moments generate an electric field based on their direction and strength, the movement of this wavefront creates an electric field in the tissue.
Now, what about when we zoom out even further to the whole heart?
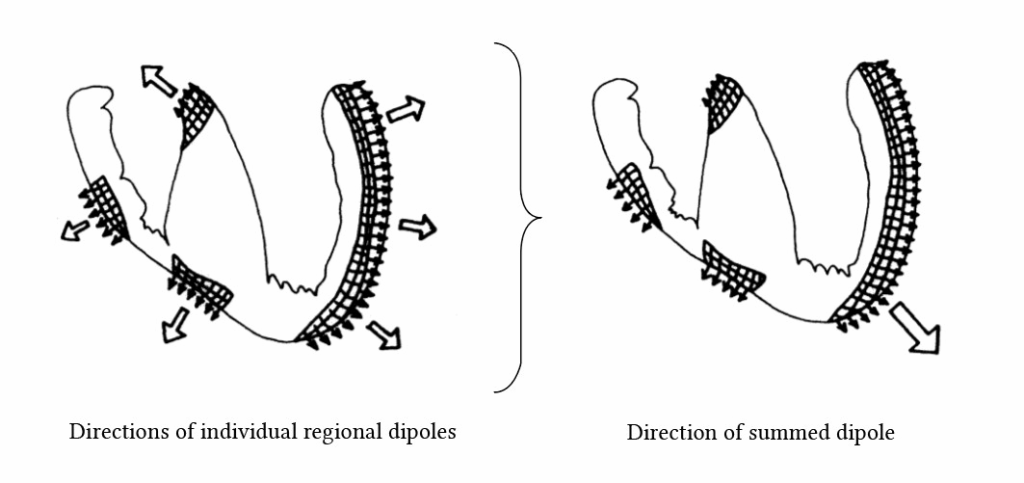
Depolarization wavefronts occurring simultaneously in different regions of the heart each generate a regional dipole, with different magnitudes and directions. Then by considering the cumulative effect of all these regional dipoles, you can extrapolate a single net cardiac dipole moment which represents the heart’s overall electrical activity at any given instant.
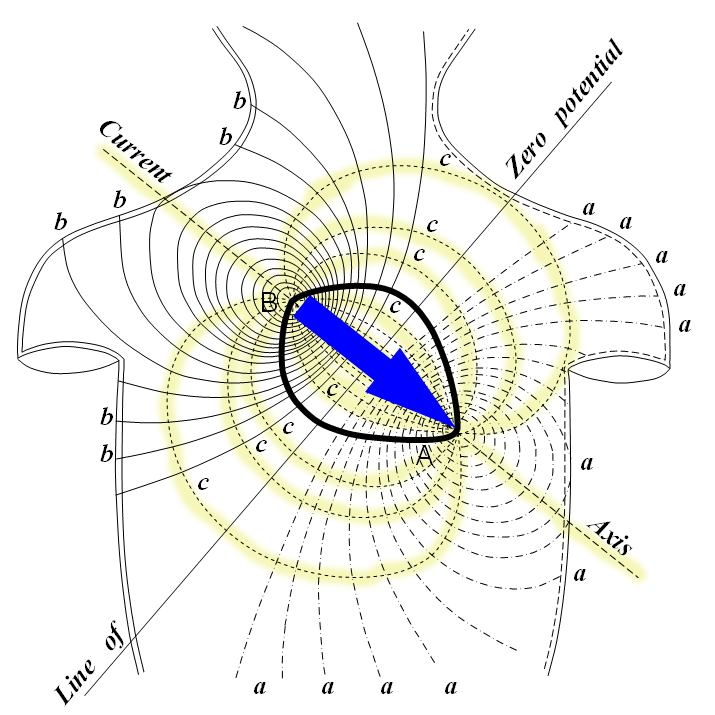
The net dipole moment generated by the heart creates its own electrical field. As the comprehensive diagram on the right shows, the heart (the bold, almond-shaped object in the middle of the chest) has a net dipole moment (blue arrow) which generates an electric field (highlighted in yellow). The remaining lines are the equipotential lines corresponding to the electric field.
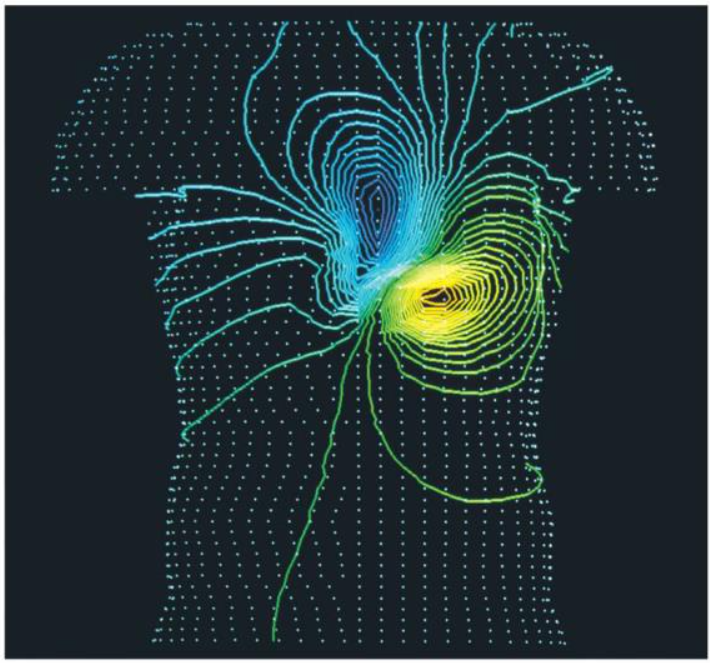
Notice how the electric field and its equipotential lines extend out across the skin, much further than the borders of the heart. The diagram you’re looking at is an idealized mathematical analogue of the heart, with perfect field lines. However, a real heart’s electrical field is not a perfect dipole, but a distorted one. The diagram below shows a more realistic model of the heart’s equipotential lines, which, despite being distorted, still resembles a recognizable version of an ideal dipole’s equipotential lines. This is all to say that the ECG is an approximation of the heart’s electrical activity, not a perfect reality.
Thinking like a scientist, we’ve already made a few key breakthroughs in figuring out how to measure the heart’s electrical activity. By visualizing the heart as a single, large dipole, we can model its complex electrical interactions as one quantifiable entity: the net dipole moment. At any given moment, the heart’s dipole moment is a singular representation of all the electrical activity happening simultaneously throughout the heart. What’s even better is that we know this dipole moment generates an electrical field that extends out to the skin. This gives us a non-invasive opportunity to detect the dipole moment from the outside. But, how would we practically do that?
The diagram above illustrates how we measure the heart’s electrical activity. To do this, we use electrodes, which are physical devices placed on the skin to measure the electric potential, or voltage, at strategic points within the heart’s electrical field. We need at least two electrodes to gain any meaningful information. A common pairing, as demonstrated in the diagram, is an electrode on the left arm and another on the right arm.
Once we have our electrodes in place, we can designate one as the reference (or negative) electrode and the other as the exploring (or positive) electrode. This pairing of a positive and negative electrode forms a lead, a mathematical construct that represents the voltage difference between the measured potentials at those two electrodes.
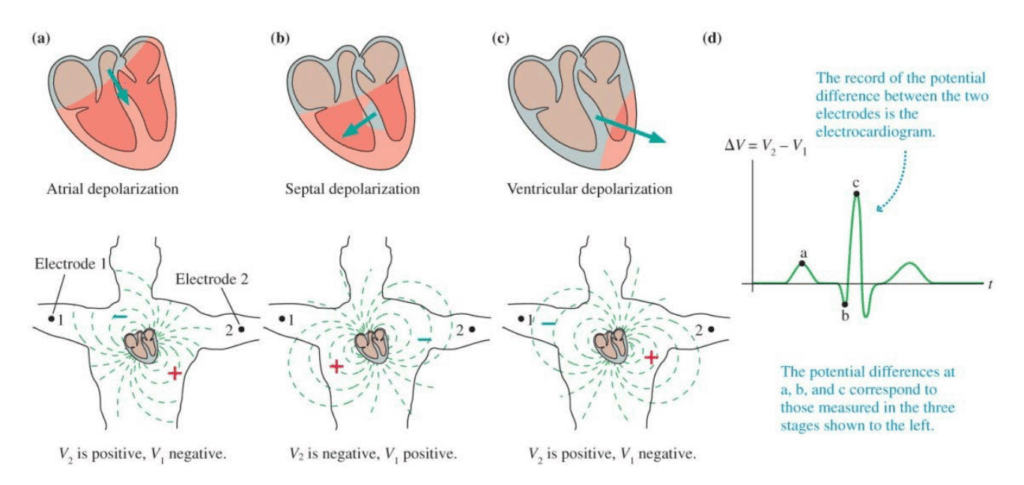
The heart’s net dipole moment generates a dynamic electrical field that extends to the skin, and this dipole moment changes constantly throughout a heartbeat. This continuous change alters the voltage across our electrodes. This allows us to determine the direction of the heart’s electrical activity. For example, if the dipole moment’s vector points toward the positive electrode in a lead, the lead registers a positive voltage difference. Conversely, if it points toward the negative electrode, the lead registers a negative voltage difference.
In this way, a lead captures the complex, summed effect of numerous cellular currents, translating them into a single, measurable signal on the skin.
If you’ve made it this far, that means you’ve endured (willingly) 3,000 words of my rambling about the detailed physics behind how ECGs work. Congratulations on your persistence. In the meantime, here’s a summary of what was discussed in this lesson to try to tie the concepts together:
Surface electrocardiography is fundamentally the measurement of the heart’s changing electrical field from the skin. This process begins at the cellular level, where changing ionic concentrations across heart muscle cell membranes creates a moving electrical imbalance, which can be modeled as a dipole. The sum of all these microscopic dipoles at any given moment produces a single net dipole moment for the entire heart—a vector representing the overall direction and magnitude of its electrical activity. This powerful cardiac dipole generates its own electrical field that propagates through the torso to the body’s surface, creating a landscape of different electric potentials, or voltages. Electrodes placed on the skin detect these subtle voltage differences. A specific pair of electrodes, forming a lead, measures the potential difference between two points, effectively viewing the heart’s dipole moment from a unique angle. As this dipole moment changes direction and strength throughout the heartbeat, the lead registers a fluctuating voltage, which the ECG machine then plots over time to create the waveform we analyze.