What am I looking at?
What am I looking at?

My earliest impression of ECGs was just a bunch of nondescript squiggles on grid paper. I didn’t even know how to navigate the ECG paper itself, yet I needed to interpret it. Here, I’ll break down what ECG paper represents and how it’s recorded so you don’t run into the same problem.
An ECG tracing is simply a graph of the heart’s electrical voltage (measured by a set of electrodes placed strategically on the body, with each set forming what is called a lead) over time, printed on grid paper to make measurement easy. The vertical axis represents voltage, or amplitude, while the horizontal axis represents time. The grid itself is composed of small 1 mm boxes, with thicker lines marking off larger 5 mm boxes, which provides a standard reference for these measurements.
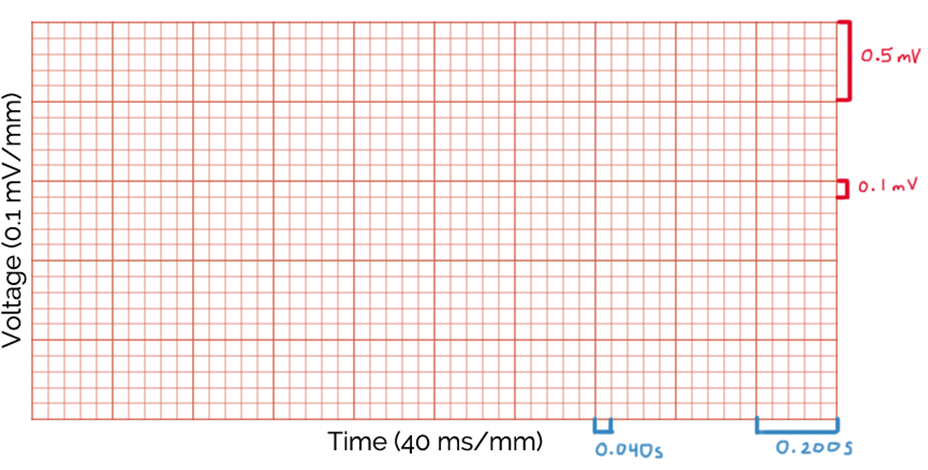
By convention, for the vertical axis, every 10 mm vertically represents 1 mV of voltage. This calibration, called the gain, can be adjusted by the operator. A normal gain is therefore 10 mm/mV. Increasing the gain (i.e., to 20 mm/mV) stretches waveforms out vertically, making them look taller, while reducing the gain (i.e., to 5 mm/mV) compresses the waveforms, making them look shorter. For this reason, you should always check the gain setting, as an unusually tall or short waveform might simply reflect a non-standard calibration rather than a true pathology.
Similarly, the horizontal time axis is usually calibrated such that each millimetre corresponds to 40 milliseconds, which is usually expressed as a paper speed of 25 mm/s. The “paper speed” can be thought of as how fast the ECG is traced from left to right. Just like gain, the paper speed can be adjusted. A faster speed like 50 mm/s stretches the waveform horizontally, while a slower speed like 12.5 mm/s compresses it. Misinterpreting a stretched-out complex as a conduction delay is a common error, so it is crucial to confirm the paper speed before analysis.
As mentioned earlier, the ECG records the heart’s electrical activity using sets of electrodes, with each set forming a single lead. There are twelve standard leads in electrocardiography: I, II, III, aVR, aVL, aVF, and V1 through V6. A standard ECG, typically recorded at a paper speed of 25 mm/s, captures ten seconds of data from each lead.
You can think of each lead as a unique perspective on the same cardiac activity, like twelve cameras filming a single event from different angles. The ECG paper is designed to display these multiple leads in a readable format, but there are several ways to arrange the data. We will review common display formats to illustrate these differences.
The 12-lead rhythm strip is probably the most intuitive format. Here, each lead is shown as a ten-second tracing stacked one on top of another. Each one of these strips can be referred to as a channel. This lets you see the full ten seconds for every lead at once. The catch, however, is that to fit all twelve leads on one page, each channel is compressed vertically by halving the gain. This can make the waveforms look smaller, thereby making it harder to measure and interpret voltages.
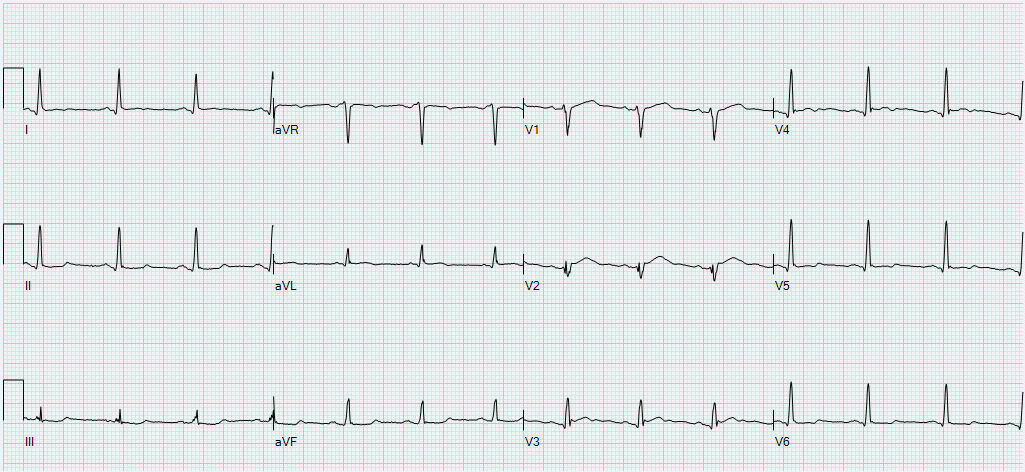
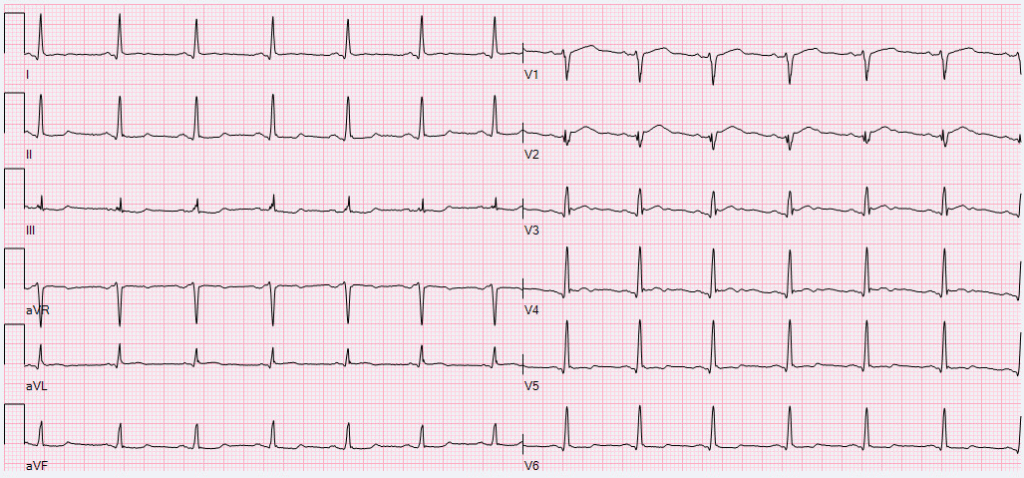
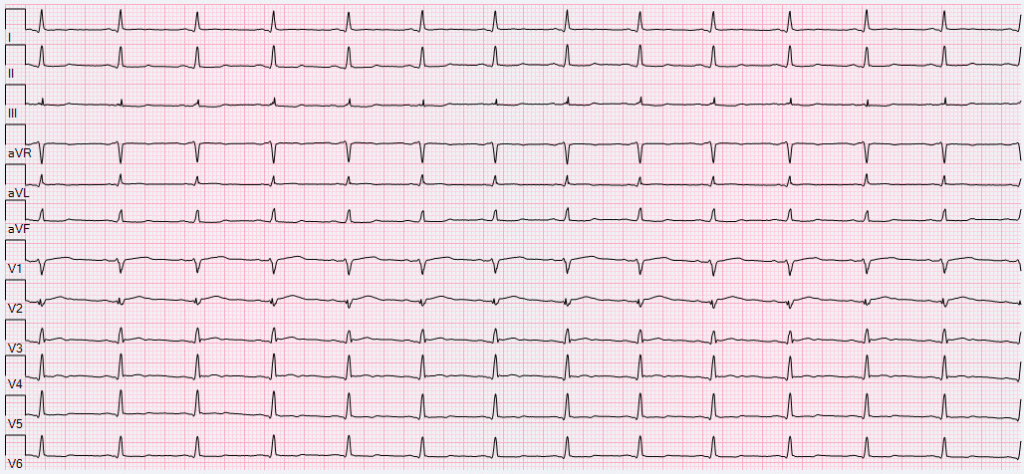
A more common layout is the 3×4 grid. Here, three horizontal channels, each demonstrating a different lead, are stacked. Every 2.5 seconds, the displayed lead switches to the next one, creating a 3×4 grid of leads that cycles through all twelve leads in sequence. Each lead is visible for only a short 2.5-second window, but this format keeps the vertical resolution high since you’re only stacking three channels instead of twelve. It’s a neat balance between space and clarity.
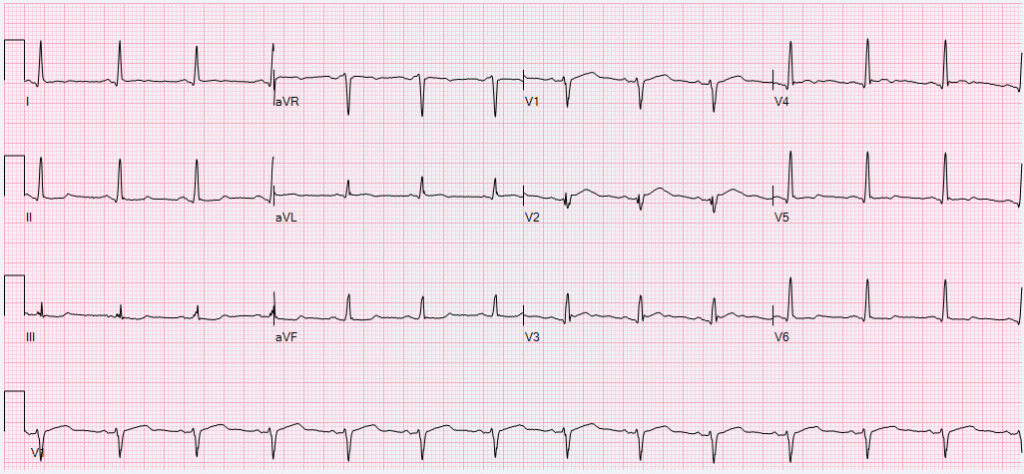
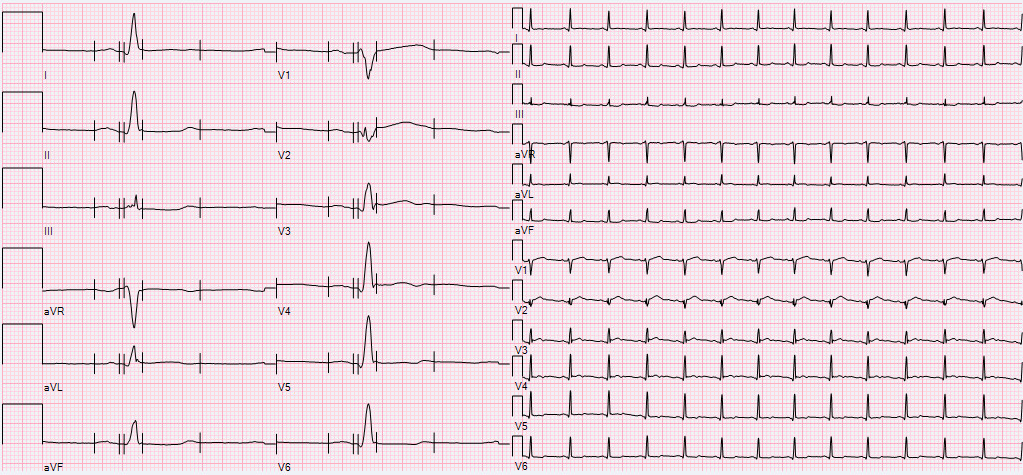
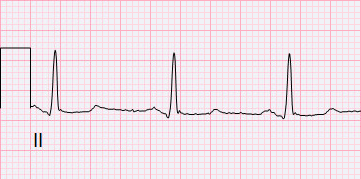
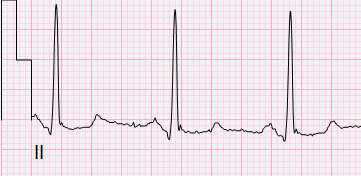
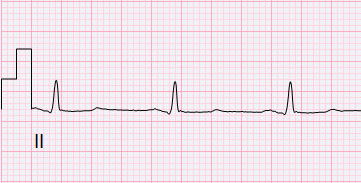
A popular format combines the 3×4 grid with a rhythm strip. Three stacked horizontal channels show brief 2.5-second snapshots of each lead, while a continuous ten-second tracing of a single lead (usually Lead II or V1) runs along the bottom. This continuous channel provides an uninterrupted view of the cardiac activity and serves as a reference when comparing the “snapshots”. The layout highlights the details of each lead while keeping an overall perspective, making it very handy.
There are, of course, many other formats that ECGs can display information, but the ones above will be our focus.